How to Choose the Best Air Pollution Detection Drones?
Air Pollution Detection Drones are changing how teams inspect pollution across roads, industrial sites, farms, and hard-to-reach areas. A compact aircraft can carry sensors above a busy intersection, trace a plume, or sample air near a rooftop. The view is useful. But a drone is only as reliable as its sensor, setup, and flight plan. Buyers should match the instrument to target pollutants, such as particulate matter, nitrogen dioxide, ozone, or volatile organic compounds. One sensor rarely measures everything well. That detail is easy to overlook.
Choosing a platform also means weighing payload capacity, flight time, wind tolerance, battery changes, and data quality. A lightweight quadcopter may suit short inspections, while longer surveys may need a different aircraft and operating plan. Ask how the sensor is calibrated, how often it needs maintenance, and whether readings are time-stamped and georeferenced. Field conditions matter: rotor wash can disturb samples, and hot or humid weather may affect some measurements. Results should be checked against suitable reference instruments whenever possible. Drones support monitoring; they do not automatically replace fixed stations or expert interpretation. This guide compares practical selection criteria, common sensor trade-offs, and questions to ask suppliers. It also notes where evidence remains uncertain. No platform is perfect. A careful choice starts with a clear monitoring goal, not the most impressive specification sheet.
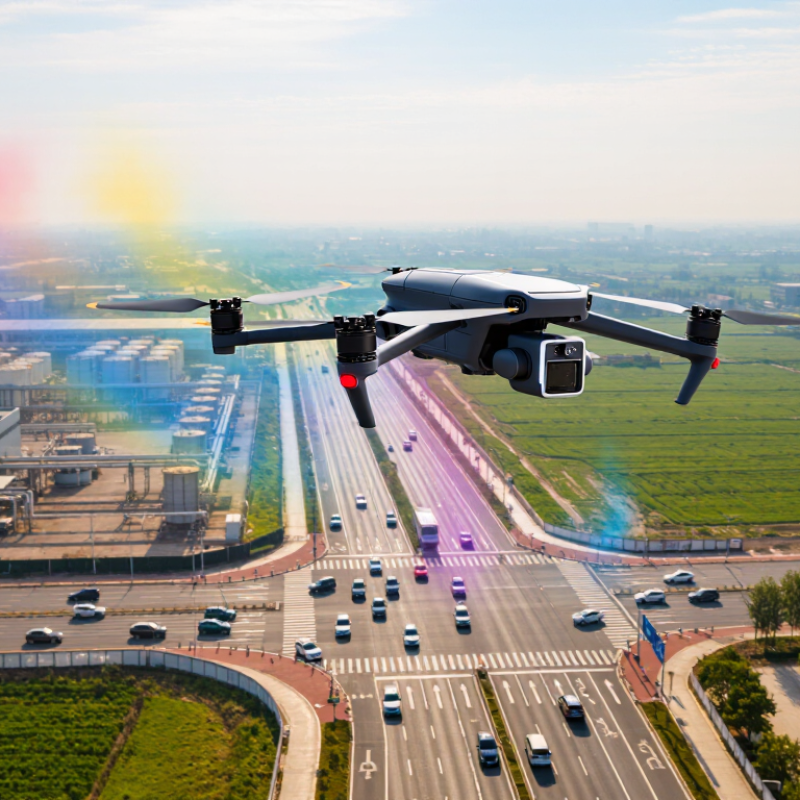
Define Monitoring Goals Using WHO PM2.5 Guidelines: 5 μg/m³ Annual, 15 Daily
How to Choose the Best Air Pollution Detection Drones? Start with the monitoring question, not the aircraft. The WHO’s 2021 air quality guidelines set PM2.5 levels at 5 μg/m³ annually and 15 μg/m³ over 24 hours. These are health-based reference values, not limits a brief drone flight can prove or disprove. The 2023 World Air Quality Report by IQAir found that only seven countries and territories met the annual WHO PM2.5 guideline. That gap makes reliable local monitoring important.
Choose a drone and sensor setup that can collect repeatable data at the height and locations you need. Check the sensor’s stated range, resolution, humidity response, and calibration method. Rotor wash may disturb nearby particles, while a single flight captures only a snapshot. Compare readings with a ground monitor, and record time, altitude, weather, and flight path. For annual comparisons, use long-term, quality-controlled measurements; don’t treat scattered flights as an annual average. I would still question any unusually precise reading from a low-cost sensor.
Tips: Plan repeated routes near roads, schools, or suspected emission hotspots. Fly at consistent heights, and log humidity and wind. Compare results with a nearby reference station. Small differences matter near 15 μg/m³. Keep the raw data.
How to Choose the Best Air Pollution Detection Drones? — Define Monitoring Goals Using WHO PM2.5 Guidelines: 5 μg/m³ Annual, 15 μg/m³ Daily
| Monitoring Goal | Relevant Measurement | WHO Air Quality Guideline Reference | Useful Drone and Sensor Characteristics | Key Limitation or Quality Check |
|---|---|---|---|---|
| Screen long-term PM2.5 exposure patterns | PM2.5 mass concentration, reported in μg/m³ | Annual mean: 5 μg/m³ | Plan repeated, consistent flights and compare measurements with nearby ground-based monitoring data. Choose a payload that can record time, location, altitude, and sensor status alongside readings. | Short drone flights cannot establish an annual mean or demonstrate annual guideline attainment. Long-term assessment requires representative measurements over time. |
| Map short-term PM2.5 variation | PM2.5 time series and spatial measurements | 24-hour mean: 15 μg/m³, defined by WHO as the 99th percentile (about 3–4 exceedance days per year) | Use a stable sampling route, record timestamps and flight altitude, and collect repeated observations across the area of interest. | A brief flight result is not equivalent to a 24-hour mean. Account for changing wind, weather, and activity during the measurement period. |
| Find local hotspots or investigate possible sources | PM2.5 concentration gradients, with wind direction and speed recorded where practical | Use the 5 μg/m³ annual and 15 μg/m³ 24-hour values as health-based context, not as limits for an individual instantaneous reading. | Prioritize repeatable routes, adequate location and altitude logging, and sensors with response times suitable for the drone’s speed. | Concentration patterns alone do not prove the source of pollution. Wind, plume movement, and nearby sources can change readings rapidly. |
| Compare measurements across different days or locations | PM2.5 measurements paired with temperature and relative humidity | WHO PM2.5 guideline values are concentration averages over specified periods; they are not single-reading thresholds. | Use the same sensor configuration, flight height, route, and sampling procedure where possible; document weather conditions for each flight. | Optical particulate sensors can be affected by humidity and particle properties. Check performance against an appropriate reference or collocation measurements. |
| Measure pollutant patterns at different heights | PM2.5 concentration by altitude, with synchronized time and position data | The WHO PM2.5 guideline values are ambient-air concentration guidelines, not altitude-specific values. | Select a payload with secure mounting and reliable data logging; make controlled vertical profiles and repeat them under comparable conditions. | Rotor airflow and movement can affect sampling. Evaluate inlet placement and compare airborne readings with suitable ground measurements. |
| Support a defensible monitoring program | PM2.5 readings plus calibration, maintenance, and flight records | Compare averages with the matching WHO averaging period: annual mean or 24-hour mean. | Choose a system that allows calibration checks, data export, sensor maintenance, and documentation of the sampling method. | Drone-mounted screening measurements do not automatically constitute regulatory or reference-monitor data. Follow applicable local monitoring requirements. |
Reference: WHO Global Air Quality Guidelines (2021). The guideline levels are health-based recommendations; applicable legal standards and monitoring methods vary by jurisdiction.